There are several things to keep in mind when taking light measurements and making lighting calculations, so let’s take a journey through the things you need to consider.
Measuring Light with a PAR Meter
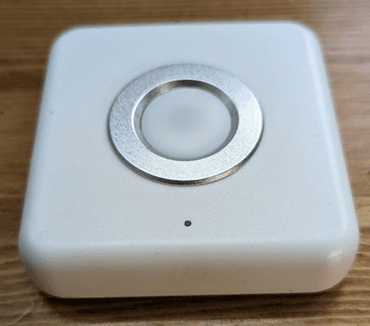
In order to make lighting calculations, you need to be able to measure the photon output of your lights (PPFD). To do so, you use a PAR meter. There is a wide range of PAR meter options available, but you should be able to find a basic PAR meter for $60 to $100 – like the one shown here.
There are some phone apps that may effectively measure PAR, but you will get more accurate results from a specialized meter. Some meters can also give you measurements broken down by light spectra (Red, Green, and Blue) – which is very helpful for assessing different lighting options.
Once we have our meter, we can start recording our light intensity. One way we do that is by measuring the light in multiple locations on a growing shelf and creating a light distribution map.
Light Distribution and Light Mapping
Light distribution is a measure of how well light is distributed across your growing space. According to Eric Runkle (2017) of MSU, “A target for sole-source lighting is for variation in a growing area to be within 20 percent, but this is usually difficult to accomplish.” So don’t get discouraged if you find it difficult to get uniform light distribution in your system!
Within any given space under a light source – both vertically and horizontally, the PPFD will vary. We can create a PPFD Map by using a PAR meter to record the light intensity at various locations under the light source. I like to do my light measurements at three heights:
- The height of your crop when it gets uncovered from the germination stage. This is the earliest point in a crop’s life when it will get light.
- The height of the crop at its midway point of growth
- The height of the crop at maturity.
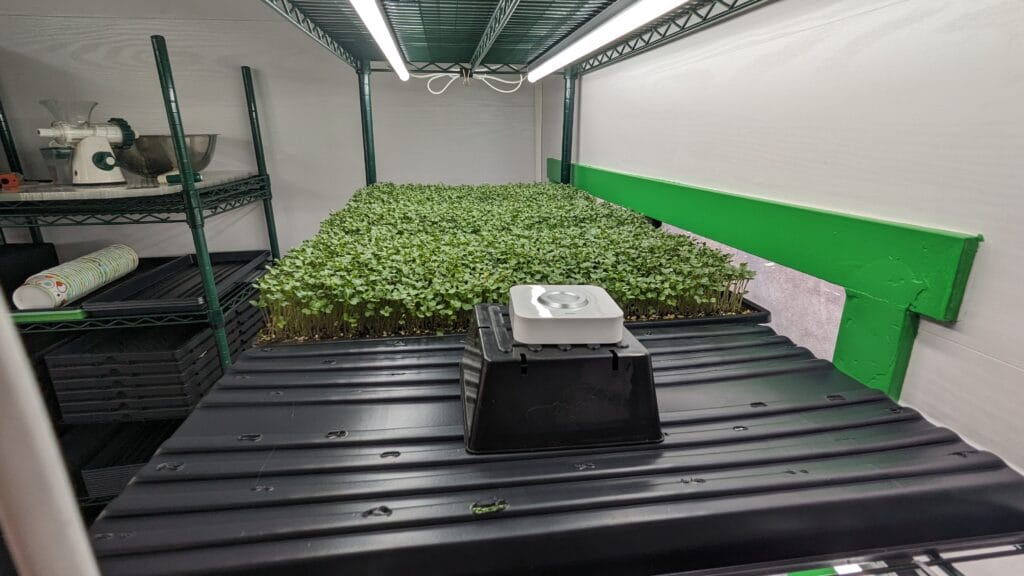
The image on the right here shows an example of using a PAR meter. We move the meter to set locations across each shelf to take light measurements and use the measurements to create our map. You can watch a short timelapse video of the process here.
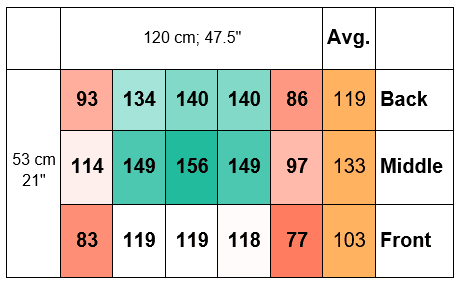
The map to the right shows the PPFD values gathered by the PAR meter from 2 x 42W LED lights, each with dual reflectors, on a 48” x 21” shelf where the PAR sensor is set 24 cm from the light – the crop height at uncovering time.
Green values are higher and red values are lower. We can use the average PPFD value (118) from this map and our photoperiod to calculate DLI.
Below is the same map beside two others at 14.5 cm and 7.5 cm, from the light, respectively, showing individual PPFD values and averages.
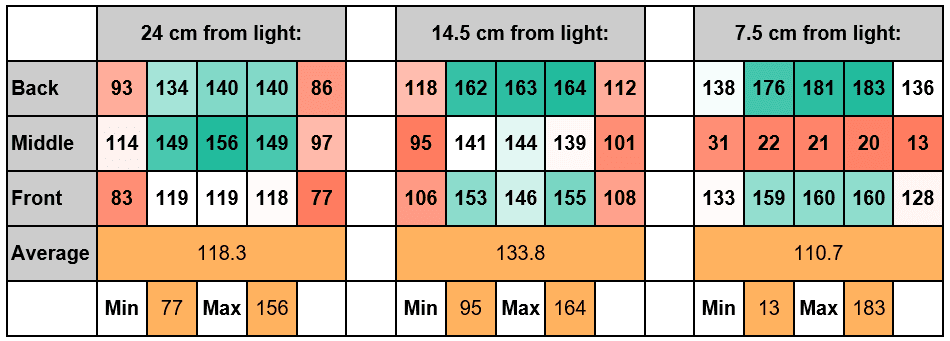
Take a bit of time to look at the values in the maps and try to determine why they change like they do with each change in height with the lighting setup shown above (more later!).
Here are a few notes to help you understand the lighting maps above:
- The “back” values are higher than the “front” values at each height due to the back wall being a white reflective surface and the front being open (and thus “wasting” light that is not reflected back toward the crop ).
- Notice how the middle values get lower as you get closer to the lights? This is because the dual reflectors block the light from reaching the space between them (see image below).
- The outside edge values are also generally lower at all heights due to light loss and from being further from the lights.
We can use the information in our maps to make better-informed lighting decisions about different setups (more on this later) and we can use the average values generated along with the photoperiod to make our lighting calculations.
Leave a Reply